Data Frame EDA Packages Comparison: DTale
In this Article we talk about Implementation of D-Tale using practical examples with code
Before we begin to learn about D-Tale Automated Library, we’ll go over to learn what EDA is?, Objectives ( How it is performed ), How the EDA performed with python, Different Libraries in python for the purpose of performing EDA

 What is EDA ?
Exploratory Data Analysis (EDA) is a crucial phase in the data analysis process that involves examining and visualizing data to uncover patterns, trends, and insights. Its primary objective is to gain a deeper understanding of the dataset before diving into more complex analyses. EDA plays a pivotal role in shaping subsequent data-driven decisions and model development.
 Objectives ( How EDA is performed )?
Understand Data Structure: EDA aims to comprehend the structure of the dataset, including the distribution of variables, data types, and potential outliers or missing values.
Identify Patterns and Trends: By utilizing various statistical and graphical techniques, EDA seeks to identify patterns and trends within the data, helping analysts to formulate hypotheses and guide further investigations.
Check Assumptions: EDA allows analysts to check assumptions underlying statistical models, ensuring that subsequent analyses are based on a solid understanding of the data.
Feature Engineering Insights: Exploratory Data Analysis provides insights into feature engineering possibilities, helping data scientists create meaningful features that can improve model performance.
Detect Anomalies and Outliers: EDA helps identify anomalies and outliers, which may be indicative of errors in data collection or valuable insights for specialized analyses.
 Performing EDA with Python
Python, with its rich ecosystem of libraries, is widely adopted for EDA due to its simplicity, versatility, and powerful visualization capabilities.
 Python libraries for EDA
Pandas: Used for data manipulation and handling, Pandas simplifies tasks such as cleaning, filtering, and summarizing data.
Matplotlib and Seaborn: These libraries offer a wide range of plotting options for visualizing distributions, relationships, and trends in the data.
NumPy: Essential for numerical operations and mathematical functions, NumPy complements Pandas in handling numeric data efficiently.
Statistical Libraries (Scipy, Statsmodels): Provide functions for conducting statistical tests and generating descriptive statistics during the exploratory phase.
Jupyter Notebooks: Jupyter notebooks facilitate interactive and iterative EDA, enabling data scientists to visualize and refine their analyses step by step.
We had seen what is EDA and how it is performed with using python libraries. We can now move on to seeing what is D-Tale library is and how to use D-Tale library on our own advantage and some differences between other automated libraries with respect to D-Tale library.
 What is D-Tale ?
D-Tale is a Flask and React-based powerful tool which is used to analyze and visualize pandas data structure seamlessly. D-Tale is a Python library designed for interactive and exploratory data analysis (EDA). It provides a web-based interface that allows users to visually explore, analyze, and manipulate datasets with ease. By seamlessly integrating with popular data science libraries, such as Pandas and Matplotlib, D-Tale streamlines the data exploration process and enhances the overall efficiency of data scientists.
 What the purpose of D-Tale (Why Factor)?
The primary purpose of D-Tale is to simplify and enhance the process of exploratory data analysis. It aims to streamline the workflow of data scientists by providing an intuitive and interactive platform that allows for quick and efficient exploration of datasets. D-Tale’s user-friendly interface facilitates a deeper understanding of data structures, patterns, and relationships, thereby accelerating the decision-making process in data-driven tasks.
 How is D-Tale library is implemented for Automated Tasks
Installation:

- This Code installs the necessary library into the terminal
Import Necessary Libraries:

Code Explanation:
- This code imports the necessary libraries into the notebook
Loading Data:

Output:
Code Explanation:
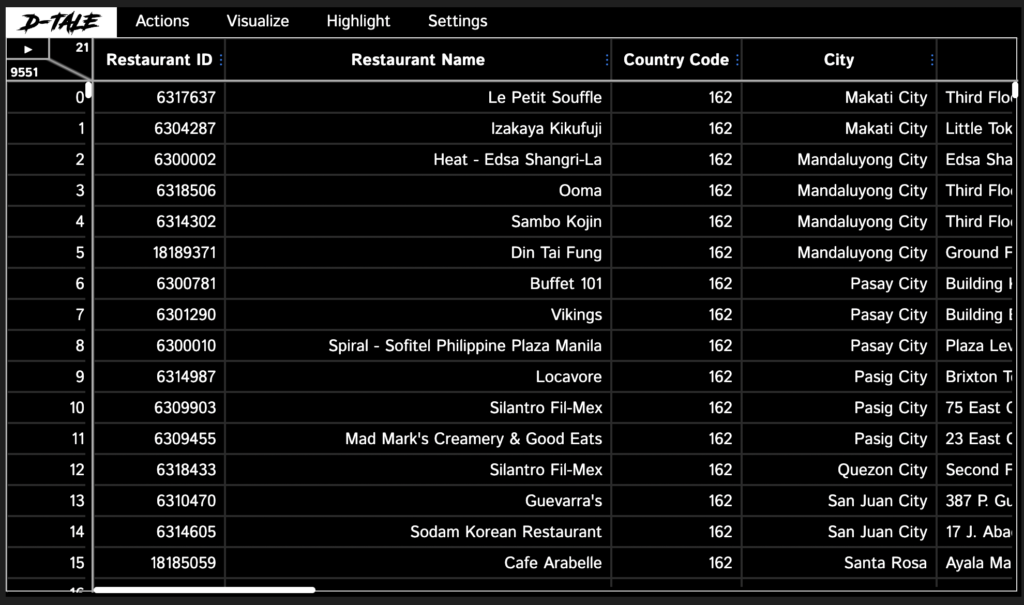
- This Code Loads the required datasets into the notebook and stored that dataset into a variable ‘df’. Here we are using the Zomato Dataset downloaded from internet.
- In Next step it creates a Interactive Dashboard to view and edit the dataset according to our business needs.
Descriptive Statistics:
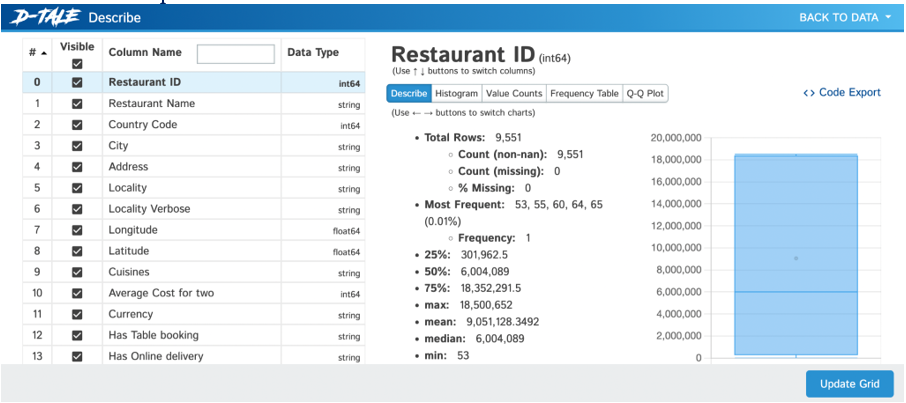
After the Interactive window is opened, click on the Visualise and then the Describe option to see the Descriptive statistics.
Using Python Code :
This can be alternatively done with the help of python code.

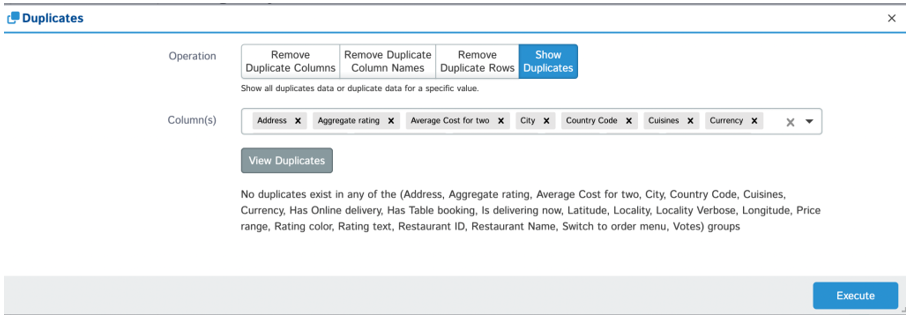
Duplicate Values:
Using Python Code :
This can be alternatively done with the help of python code.

Visualizations:
Correlation Analysis :
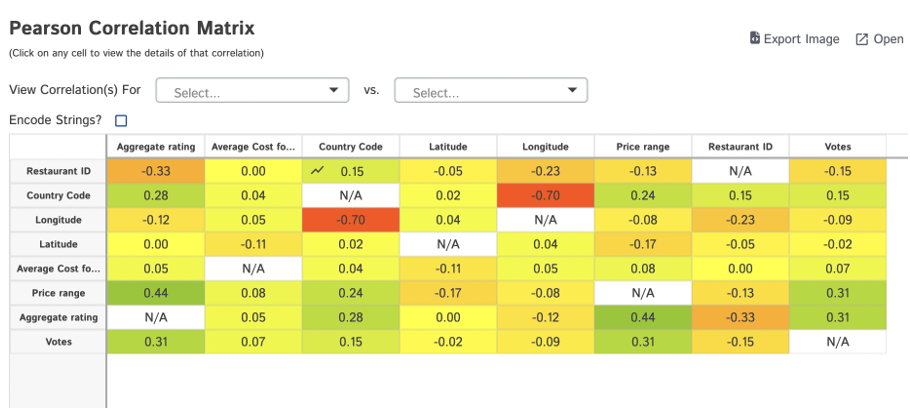
To perform Correlation Analysis of the given data, Click on Visualize and then the Correlations option in the Interactive Window already created.
Using Python Code :
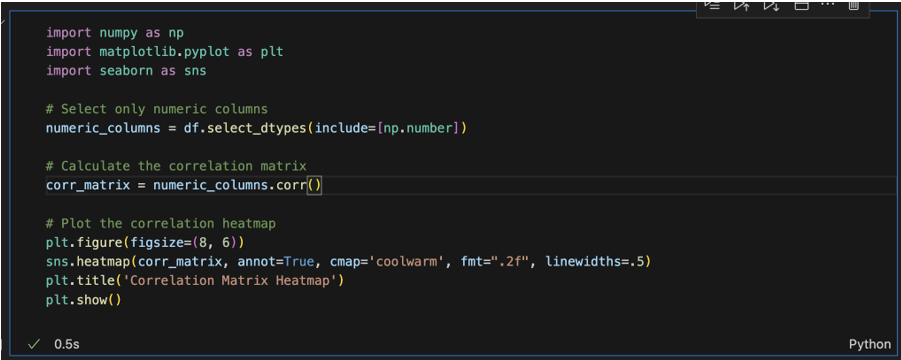
This can be alternatively done with the help of python code.
Feauture Analysis by Correlation :
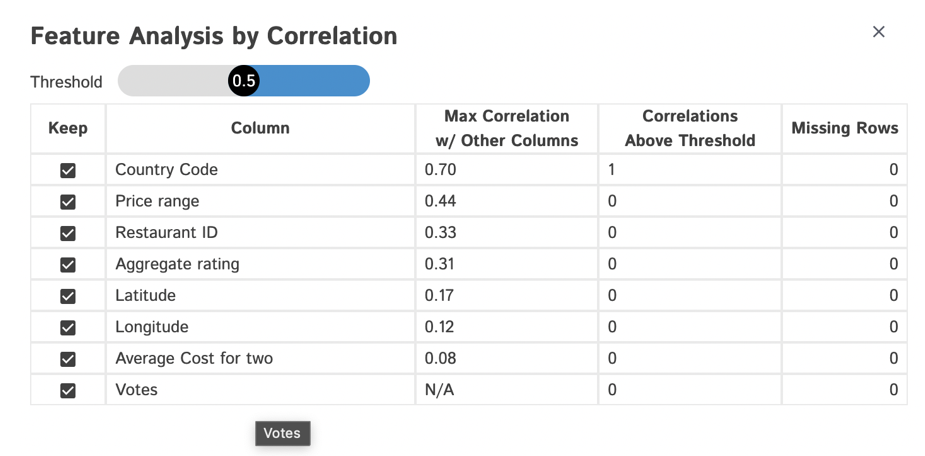
To Analyse Feautures by correlation, Click on Actions and then the Feauture Analysis option in the Interactive Window created.
Using Python Code :
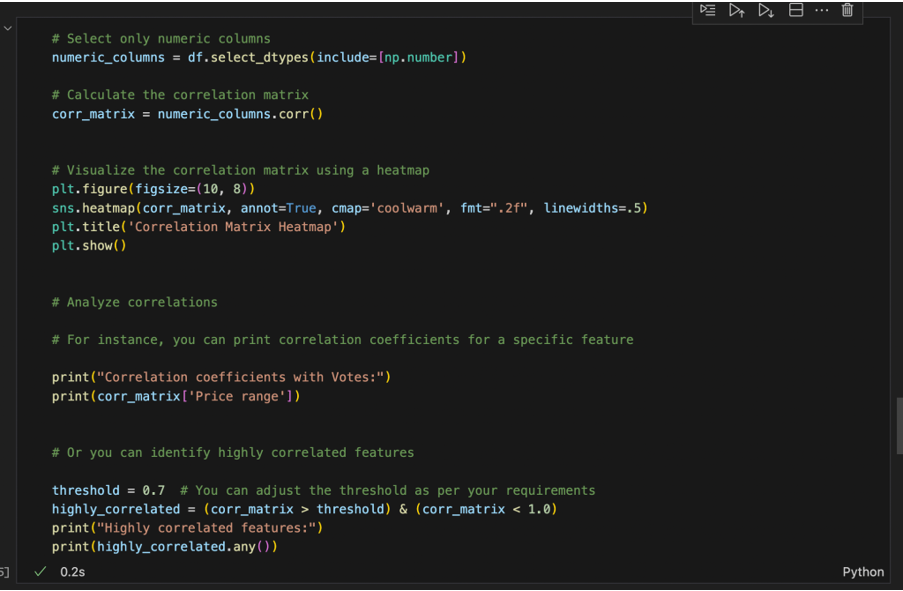
This can be alternatively done with the help of python code.
Heat Map :
To create and Visualise any Charts or visual, Click on Visualise and then the Heat Map option in the Interactive Window already created.
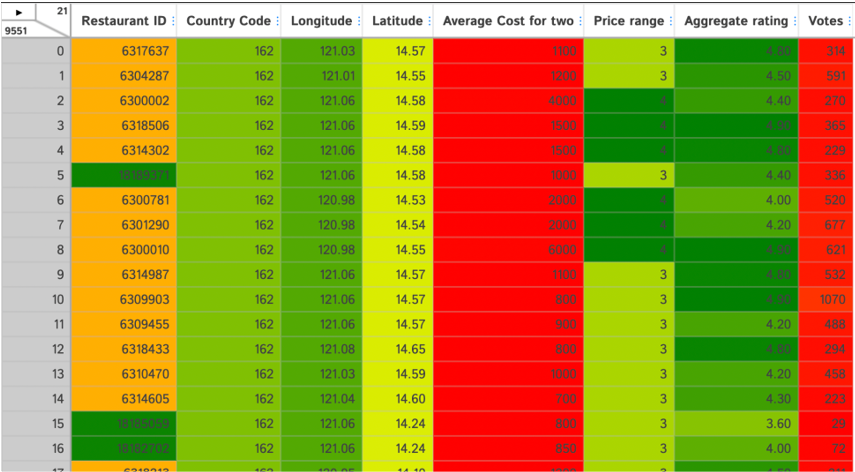
Using Python Code :
This can be alternatively done with the help of python code.

Charts:
To create and Visualise any Charts or visual, Click on Visualise and then the Charts option in the Interactive Window already created.
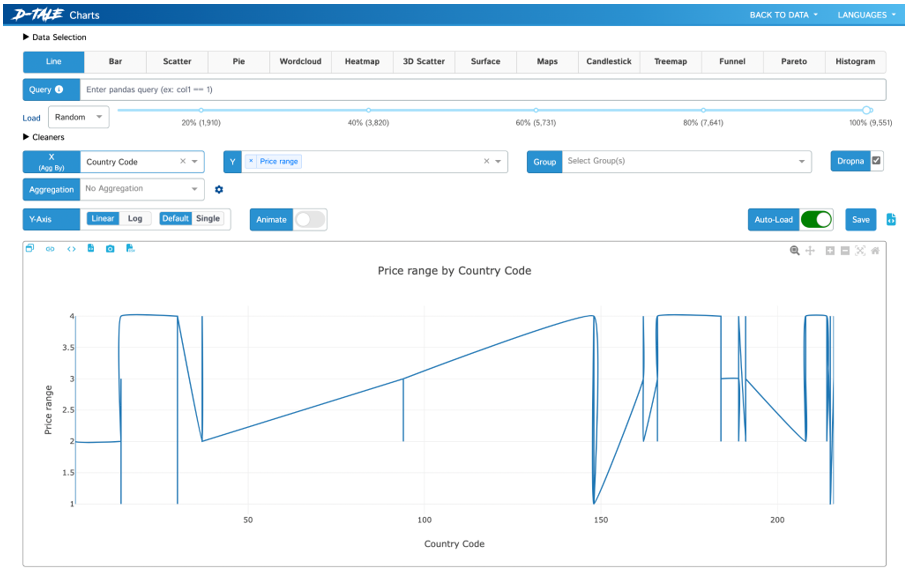
Using Python Code :
This can be alternatively done with the help of python code.

Exporting Data:
To Export the Edited data we can directly click on Export option from D-Tale Menu in the Interactive Window already created.
Data preparation:
After the Interactive window is opened, click on any row or column and be flexible to do any change in the table, for every change we perform in the table, there would be created a separate code in the Export Code option from D-Tale Menu. We can copy and paste it directly to the notebook.
We had clearly seen how the D-Tale library is used and how easy the user interface is to wok with. We can now see how it is different from some of the other automated libraries.
 How it is different from other Automated libraries?
D-Tale distinguishes itself from other automated libraries by offering a dynamic and interactive web-based interface. While other libraries may focus solely on automation, D-Tale combines automation with an intuitive user experience. Its integration with Pandas makes it easy to use for those familiar with data manipulation in Python. The ability to generate live, interactive visualizations and summary statistics sets D-Tale apart, providing a unique and powerful tool for exploratory data analysis that stands out in the realm of automated libraries.
D-Tale vs. Pandas Profiling:
Interactivity: D-Tale provides an interactive web-based interface that allows users to explore and manipulate data dynamically, whereas Pandas Profiling generates static HTML reports.
Customization: D-Tale offers more customization options for visualizations and interactive features compared to Pandas Profiling.
Real-time Updates: D-Tale updates in real-time as users interact with the data, providing immediate feedback on changes.
D-Tale vs. Sweetviz:
Interactivity: Similar to D-Tale, Sweetviz offers interactive visualizations but lacks the real-time updates and dynamic exploration features provided by D-Tale.
Web Interface: D-Tale’s web interface is integrated into the Jupyter Notebook, while Sweetviz generates separate HTML reports.
Advanced Features: D-Tale provides more advanced features for exploring correlations, filtering data, and customizing visualizations.
D-Tale vs. Pandas GUI:
Integration: D-Tale seamlessly integrates with Jupyter Notebooks, while Pandas GUI operates as a standalone graphical user interface (GUI).
Web-based Interaction: D-Tale’s web-based interaction allows for a smoother and more integrated exploration experience within the Jupyter environment.
Real-time Updates: D-Tale provides real-time updates, whereas Pandas GUI may require manual interactions to refresh.
D-Tale vs. DataPrep:
Integration with Jupyter: D-Tale is designed to work within Jupyter Notebooks, whereas DataPrep might have a broader range of integrations.
Interactive Features: D-Tale offers more interactive and customizable features compared to DataPrep, allowing for a more dynamic exploration of the data.
D-Tale vs. Speedml:
Focus: Speedml is more focused on automating machine learning workflows, including data preprocessing and feature engineering, whereas D-Tale is primarily focused on exploratory data analysis.
Interactivity: D-Tale provides a more interactive and visually rich environment for exploring data, while Speedml may be more focused on automation and efficiency in preparing data for machine learning.
We had clearly see how the D-Tale library differs from other automated libraries and how easy the user interface is to work with.
 Conclusion
In summary, D-Tale stands out with its real-time interactivity, seamless integration with Jupyter Notebooks, and advanced features for dynamic data exploration, making it a versatile choice for interactive exploratory data analysis within the Python ecosystem.


